Real-Time Dashboards: How to Display Live Business Data Effectively
"Real-time" is the most expensive adjective on a dashboard requirements list. Executives ask for second-by-second sales numbers that nobody will act on between meetings. Developers build WebSocket infrastructure for data that changes twice a day.
When immediacy is real, it matters. Production lines, service queues, fraud signals, market-facing ops: delay costs money or creates risk. The job is knowing which metrics belong in which category, then building only as much live plumbing as those metrics justify.
Most numbers do not need to twitch
Monthly sales trends don't get smarter at 500ms refresh. Customer behavior analysis is fine on yesterday's data. The useful test: would waiting five minutes, an hour, or a day change the decision? If no, you want a clear dashboard on a sane schedule, not a live feed.
Live updates earn their keep for time-sensitive ops, shared situational awareness (war rooms, trading-style desks), and threshold alerts that demand action now.
Even on a live board, not every widget should refresh at the same rate. Queue depth every few seconds; monthly resolution trend once a day. One page, mixed cadences.
I tell owners who want "real-time everything" the same thing: live vs overnight sync is one of the biggest cost drivers on a dashboard. Live needs persistent connections or aggressive polling running around the clock. Nightly is a scheduled job. The classic executive board that consolidates CRM and accounting (Salesforce or HubSpot next to QuickBooks) almost never needs every tile live. When we scope a custom web portal, picking which metrics truly need immediacy is an early conversation, not a polish item.
Three ways to move data
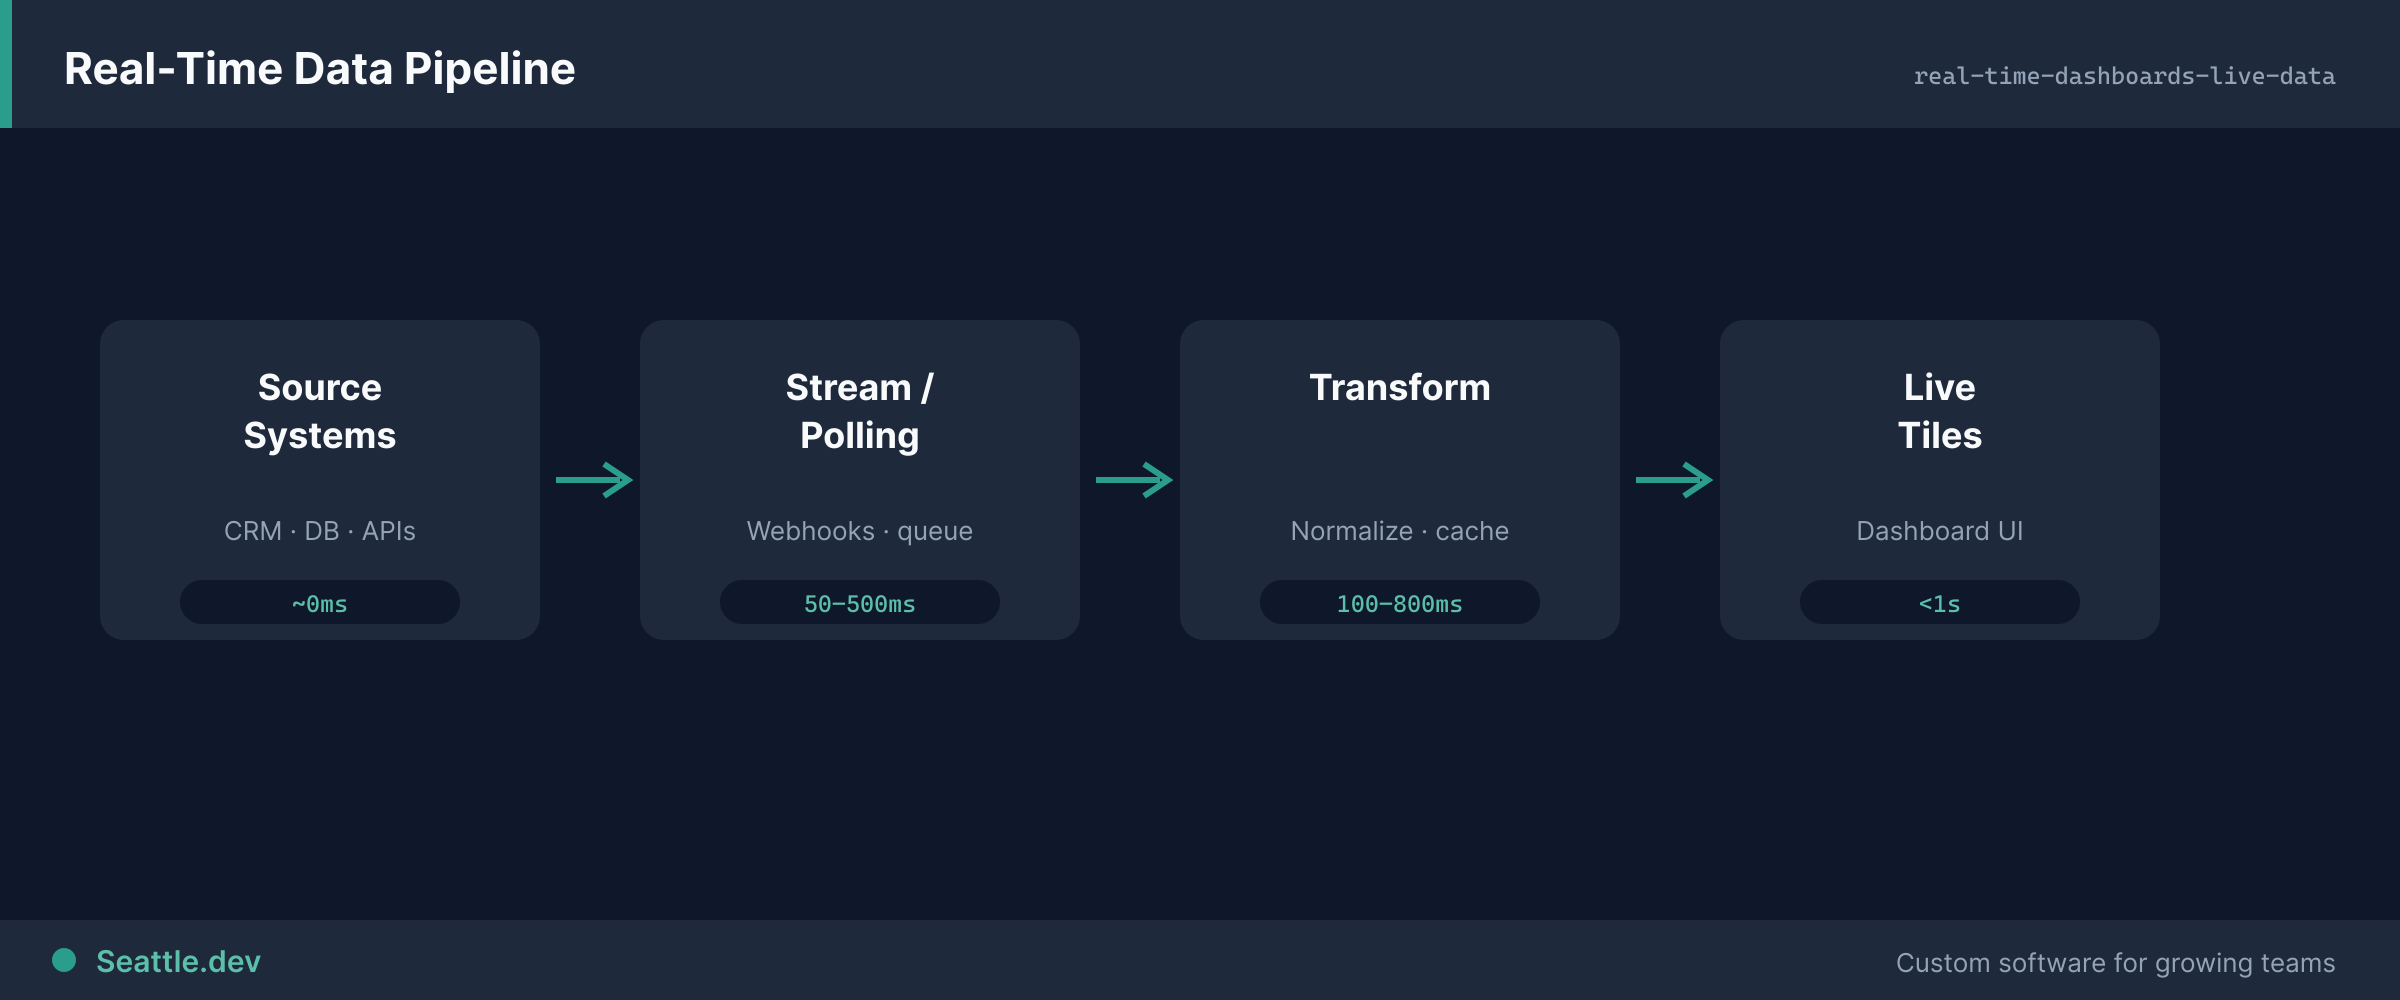
WebSockets for true push and lowest latency when many clients need the same stream. Cost: persistent connections, reconnection logic, infra that can hold thousands of sockets open without falling over. Right fit for collaborative tools, trading-style boards, continuous monitoring.
Server-sent events (SSE) when traffic is mostly server-to-client. Simpler than full duplex, plays nicer with standard HTTP infrastructure, fine for most dashboards where the UI is reading and occasionally changing a filter.
Smart polling when "near real-time" is enough. Easier to debug. Independent requests, no long-lived connection state. Wasteful if naive; better with conditional requests and backoff when nothing changed. Good at modest scale or when your stack fights persistent connections.
Pick the dullest option that meets the latency you can defend in a business case.
Design so the board doesn't scream
Humans cannot process multi-update-per-second noise. Match refresh to how fast someone can act. If staffing only changes every few minutes, queue length every second is theater.
Highlight what changed (brief emphasis, not permanent red flash). Aggregate high-volume events into rates and percentiles. Smooth spikes with rolling windows when the point is the pattern, not every blip.
Always show context next to the live number: normal range, prior period, threshold. A queue of 40 means nothing alone.
Scale before production teaches you the hard way
If every client ticks a heavy SQL query, hundreds of open dashboards become thousands of queries per second. Cache and precompute. Serve many clients from one computed snapshot. For high frequency, keep current state in Redis or an in-process cache and push from that, not from the primary OLTP database on every paint.
Broadcast once to subscribers (pub/sub) instead of N personal messages for the same metric. Let clients skip unchanged payloads (ETags, versions) and batch multi-metric updates.
Instrument connections, update rates, bandwidth, query patterns, latency. Optimize the few paths that dominate load.
Connections fail constantly
Networks drop. Tabs sleep. Laptops close. Plan for it.
Exponential backoff on reconnect. Sequence or version numbers so clients resume without gaps or duplicates. Clear status: Live / Reconnecting / Offline, with last-updated timestamps on stale data. Manual refresh as an escape hatch.
Silent freeze is how people lose trust in the whole board.
Alerts without training people to ignore them
Thresholds should fire on real problems, not normal variance. Acknowledge and snooze so one incident doesn't page the whole team. Escalate if nobody owns it.
Context in the alert matters: "Queue is 75 (3x normal for this hour), average wait 8 minutes" beats "High volume."
Match channel to severity: SMS for critical, in-app for routine. Measure acknowledgment rates and tune. Alerts that are ignored are worse than no alerts.
Security on a live stream
Auth once at connection, maintain session state carefully. Filter on the server: never broadcast everything and hope the client hides fields. Rate-limit connections and update requests. TLS everywhere. Log access for audit without turning logs into a second privacy problem.
When to build it
Only after you can name decisions that change with immediacy. If you can't, stop.
Phase it. Ship a solid dashboard with multi-minute refresh first. Add live only to the metrics that proved the refresh interval was the bottleneck. A simple internal dashboard typically runs $30,000–$50,000; the smart version of that spend launches something useful in 6–8 weeks on the biggest pain, then layers real-time where it earns its keep.
Off-the-shelf (Grafana, Datadog, similar) covers a lot when data already lives in common systems. Custom work makes sense for specialized workflows, odd sources, or proprietary systems wired through custom API development.
If you're not sure whether you need live infrastructure or a cleaner overnight board, schedule a consultation. We'll separate the metrics that justify WebSockets from the ones that only need a chart that loads fast.